
.png)
Auto Industry and Oil and Gas Sector (Facts & Figure)
Related

RIGHT SIDEBAR TOP AD
Popular
Political undertones mark CM's varsity visit
3 months ago
305

Medical team concludes Imran Khan's check-up at Adiala jail
3 months ago
260
Zero tolerance for overpricing during Ramzan: DC
3 months ago
254
Baloch leader calls on President Zardari, announces to join ...
2 months ago
254
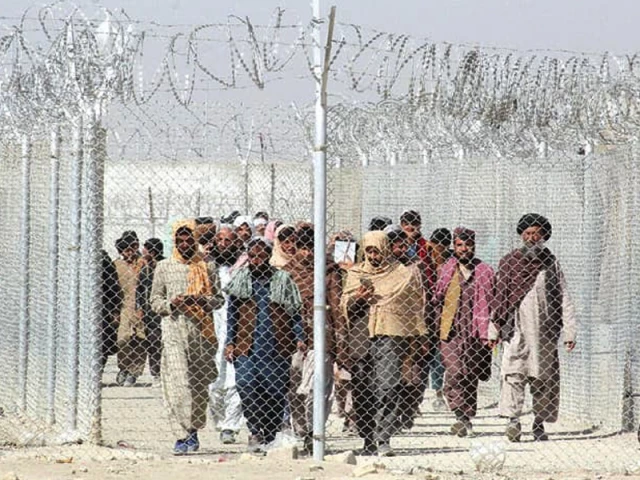
Hundreds stuck at Chaman as border remains closed after firi...
5 months ago
241
RIGHT SIDEBAR BOTTOM AD
 English (US) ·
 © Times of Pakistan 2026. All rights are reserved